Lab 03: Aluminum and Composite Tensile Testing
AE 417 · Aerospace Structures and Instrumentation Laboratory · Fall 2025 · ERAU
Experiment Overview
Choosing between aluminum alloys and fiber-reinforced composites is one of the most consequential decisions in aerospace structural design. Aluminum is reliable, well-understood, and easy to repair; composites offer far superior strength and stiffness per unit weight but require different design methods. This lab pulled three materials to fracture — Al-2024-T351, glass-fiber reinforced polymer (GFRP), and carbon-fiber reinforced polymer (CFRP) — and built the stress-strain curves that quantify those trade-offs in direct, measurable terms.
- Perform uniaxial tensile tests on Al-2024-T351, GFRP, and CFRP rods to fracture using a Tinius Olsen LVDT extensometer
- Extract Young’s modulus E, ultimate stress σu, and yield stress σy (aluminum only) from stress-strain curves
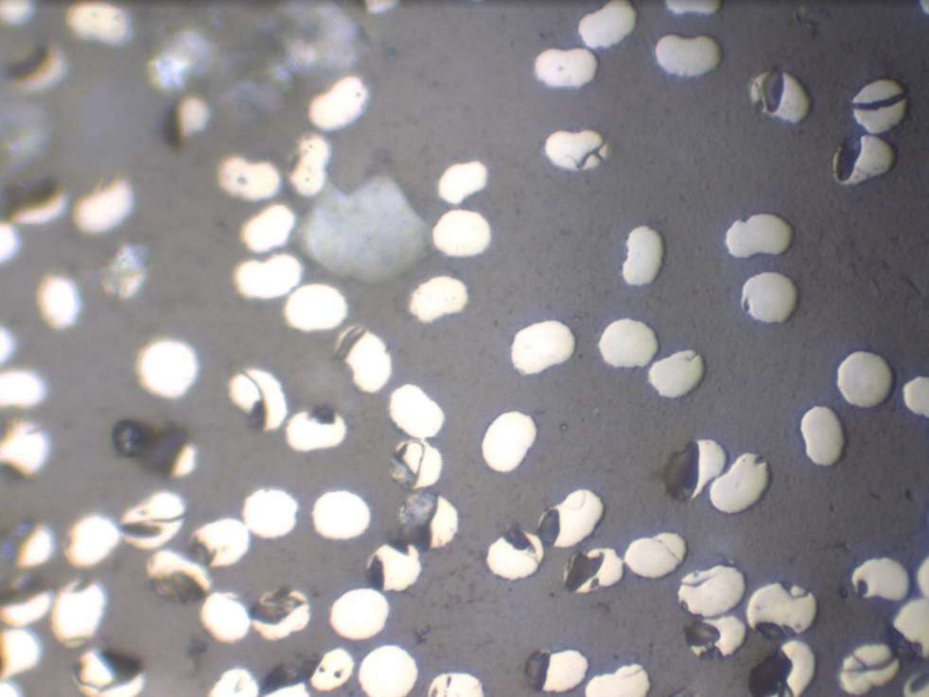
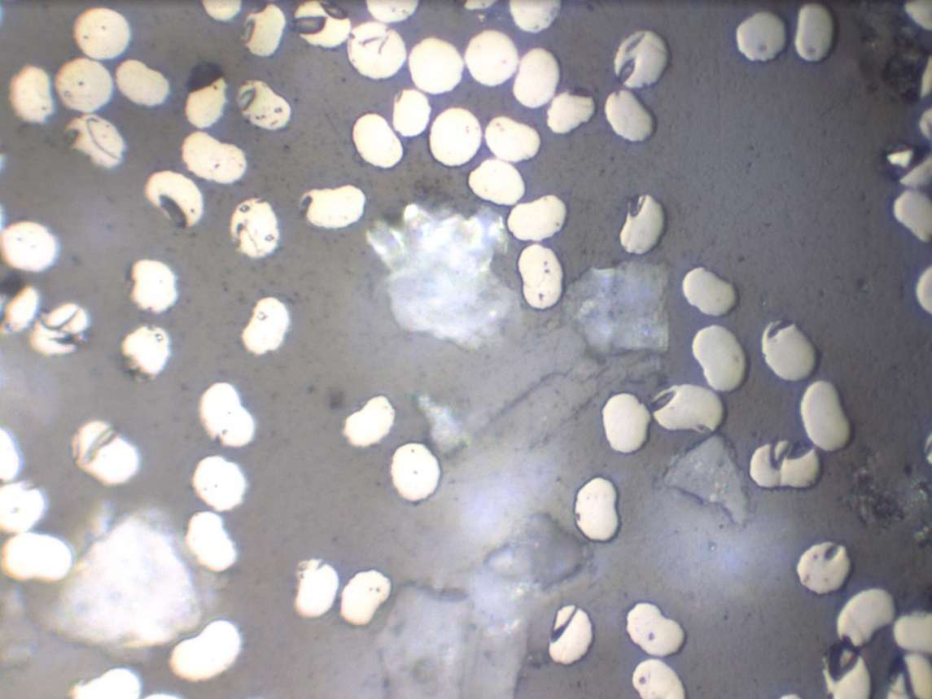
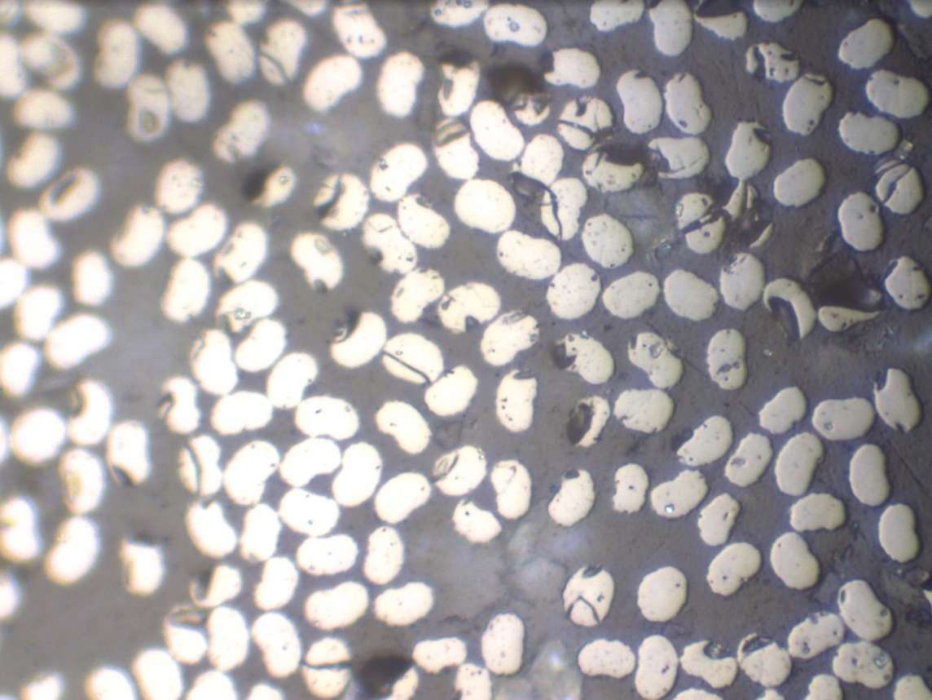
- Validate CFRP modulus independently using the rule of mixtures applied to optical fiber volume fraction measurements
- Compare strength-to-weight ratios across all three materials to quantify the weight efficiency trade-off
Equipment & Tools
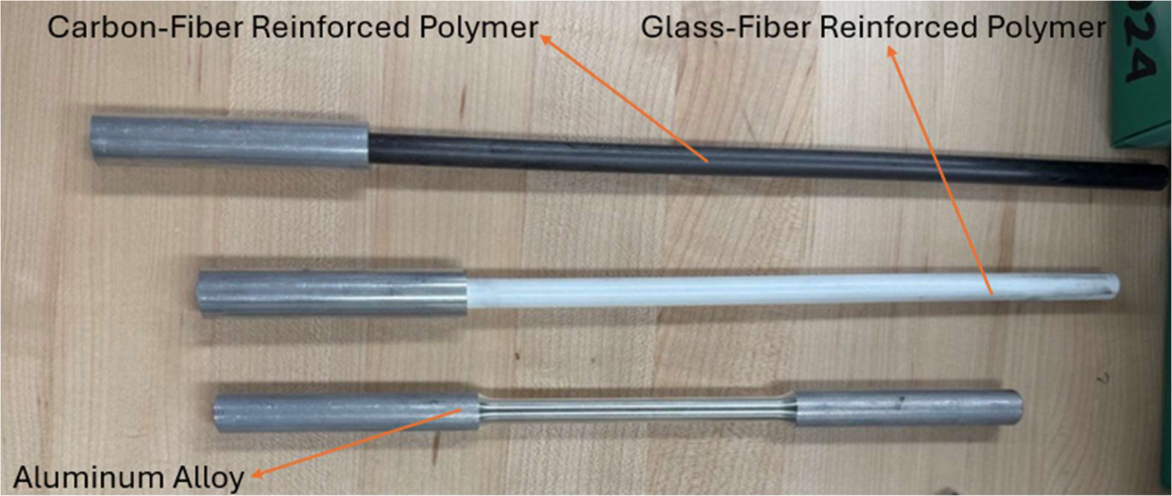
- 2024-T351 aluminum, GFRP (polyester matrix), and CFRP tensile specimens with 6061-T6 aluminum gripping tubes
- Tinius Olsen 150ST Electromechanical Universal Testing Machine with MTS 647 hydraulic wedge grips
- Tinius Olsen LVDT Extensometer
- Mitutoyo digital calipers and precision mass scale
- Hand sander (240, 320, 400, 600 grit SiC) and hot glue gun
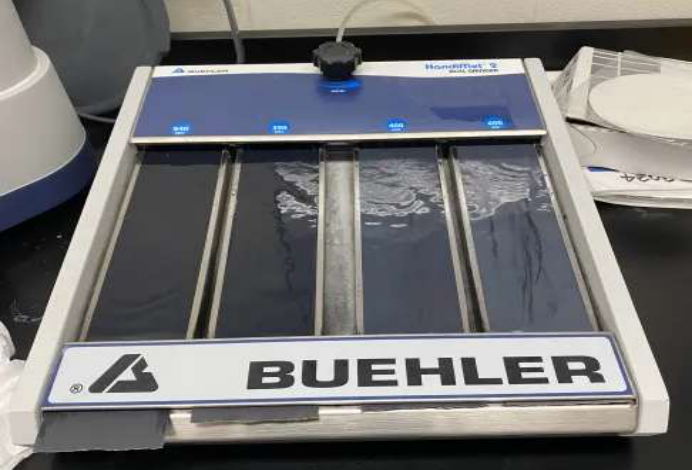
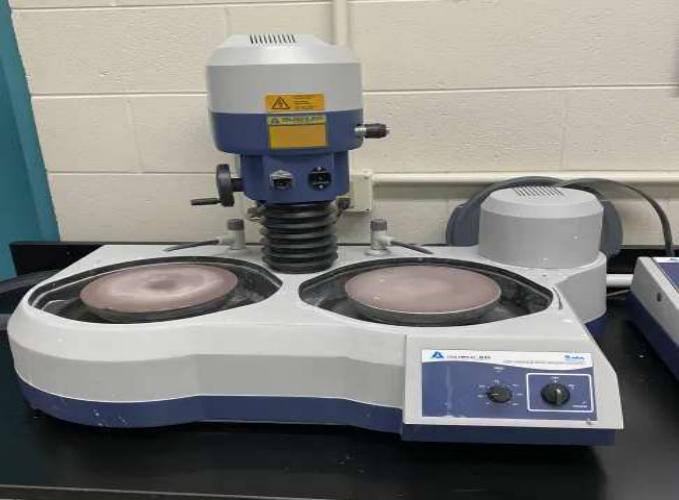
- Buehler grinding and polishing machine (320 grit SiC; 1 μm alpha alumina slurry)
- Motic metallurgical microscope with digital camera and imaging software
Approach
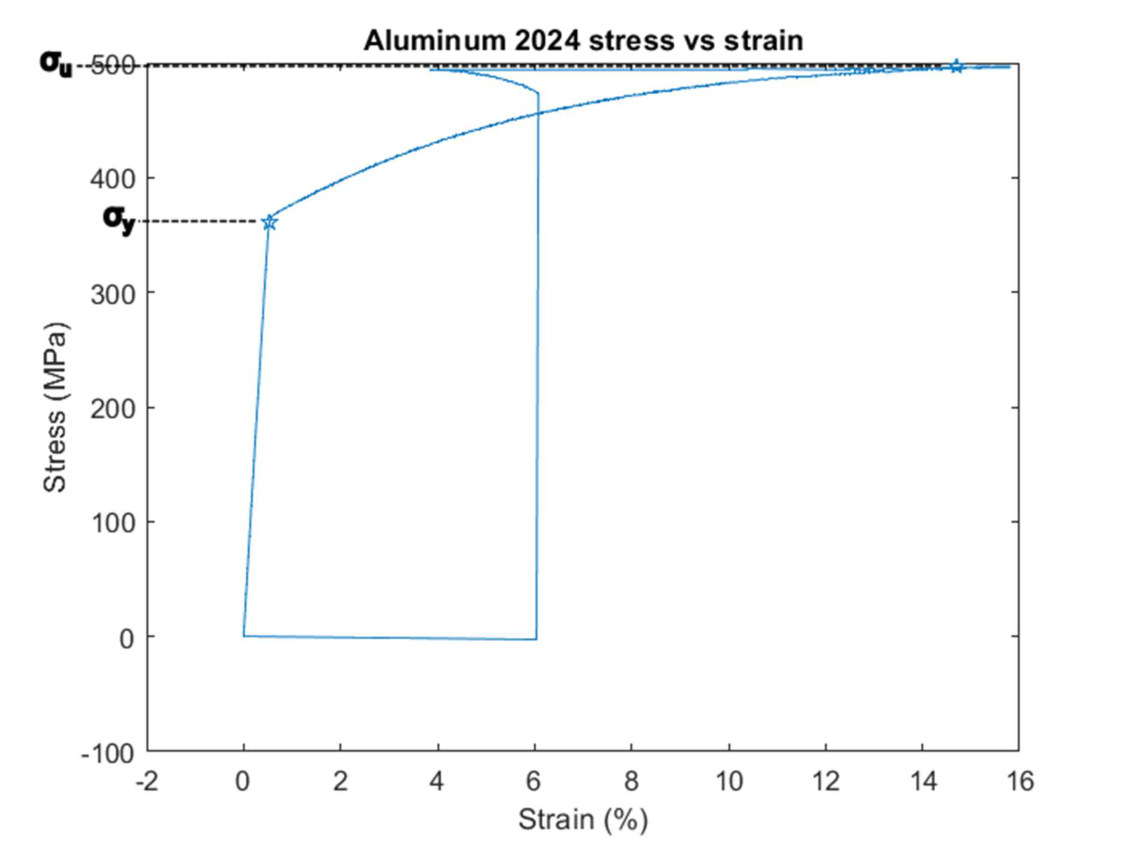
Each rod was sanded, cleaned with acetone, and fitted with 6061-T6 aluminum gripping tubes bonded with cyanoacrylate adhesive. An LVDT extensometer measured elongation at the gauge section. Young’s modulus was computed as the average of σ/ε at five points in the elastic region. Ultimate stress was the maximum recorded value; yield stress for the aluminum was found by the 0.2% offset method.
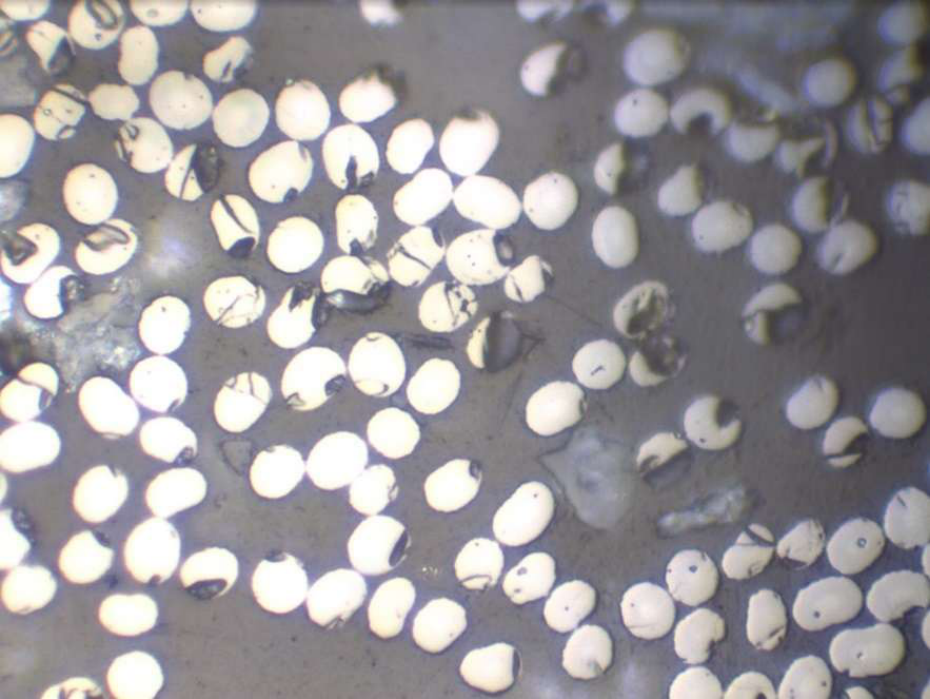
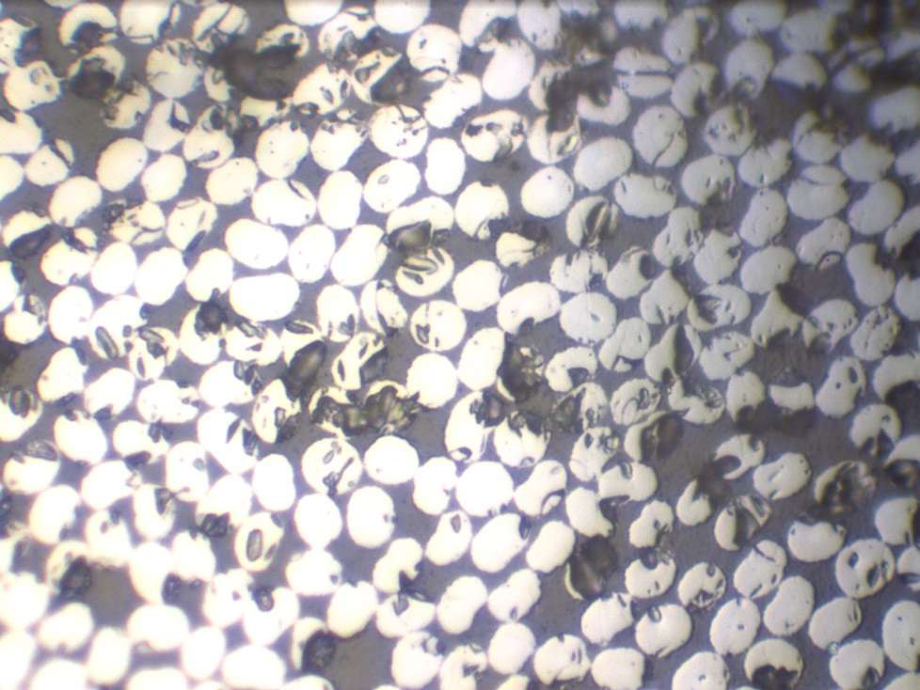
For CFRP, the standard stress-strain method severely underestimated E (by ~49%). An independent estimate was obtained using the rule of mixtures Ec = EmVm + EfVf, where the fiber volume fraction Vf was measured by counting and sizing fibers in polished cross-section microscopy images. Strength-to-weight ratios were computed by dividing ultimate stress by the measured density of each rod.
Key Results
- Al-2024-T351: E = 693 MPa, σu = 497 MPa, σy = 361 MPa. Percent differences vs. handbook: 1.3%, 1.4%, and 2.7% — excellent agreement, confirming reliable test execution for ductile metals.
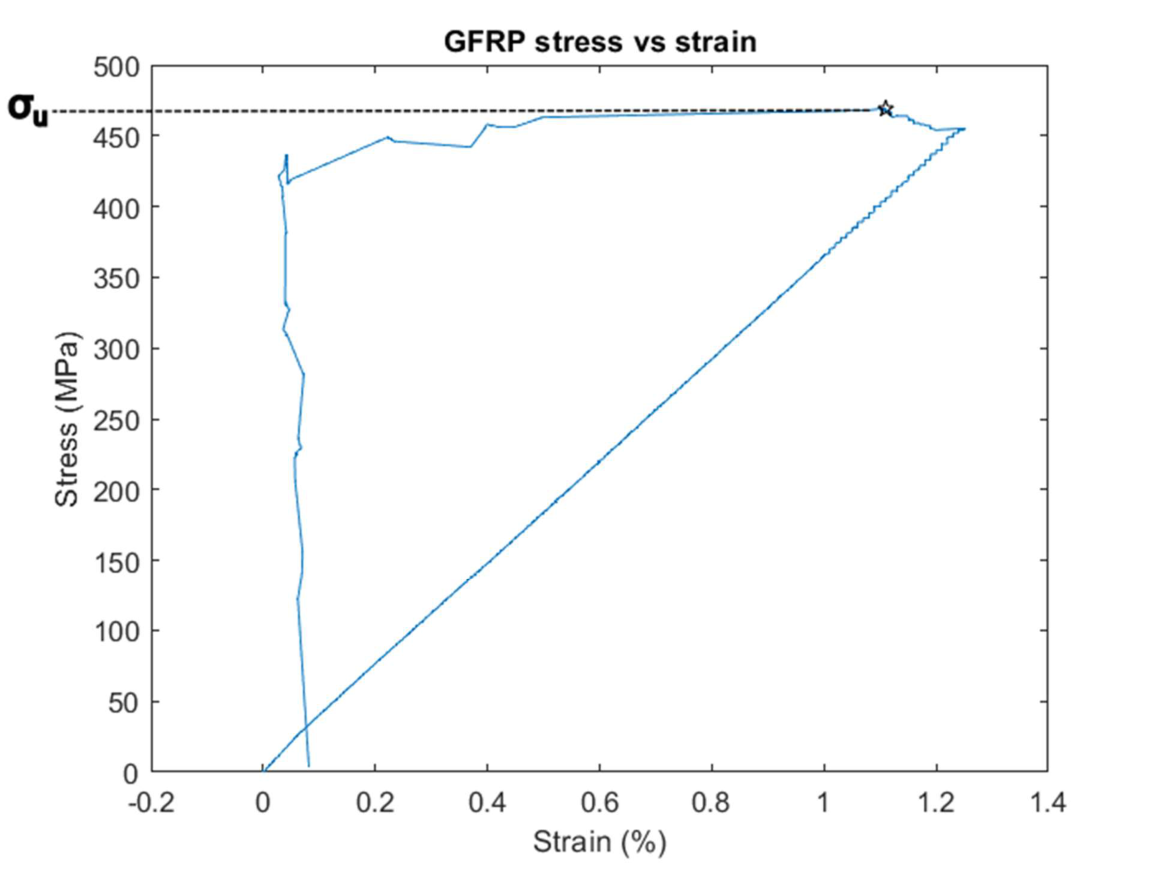
- GFRP: E = 373.9 MPa, σu = 469 MPa. Percent error vs. handbook E: 0.4% — the polyester matrix composite behaved predictably.
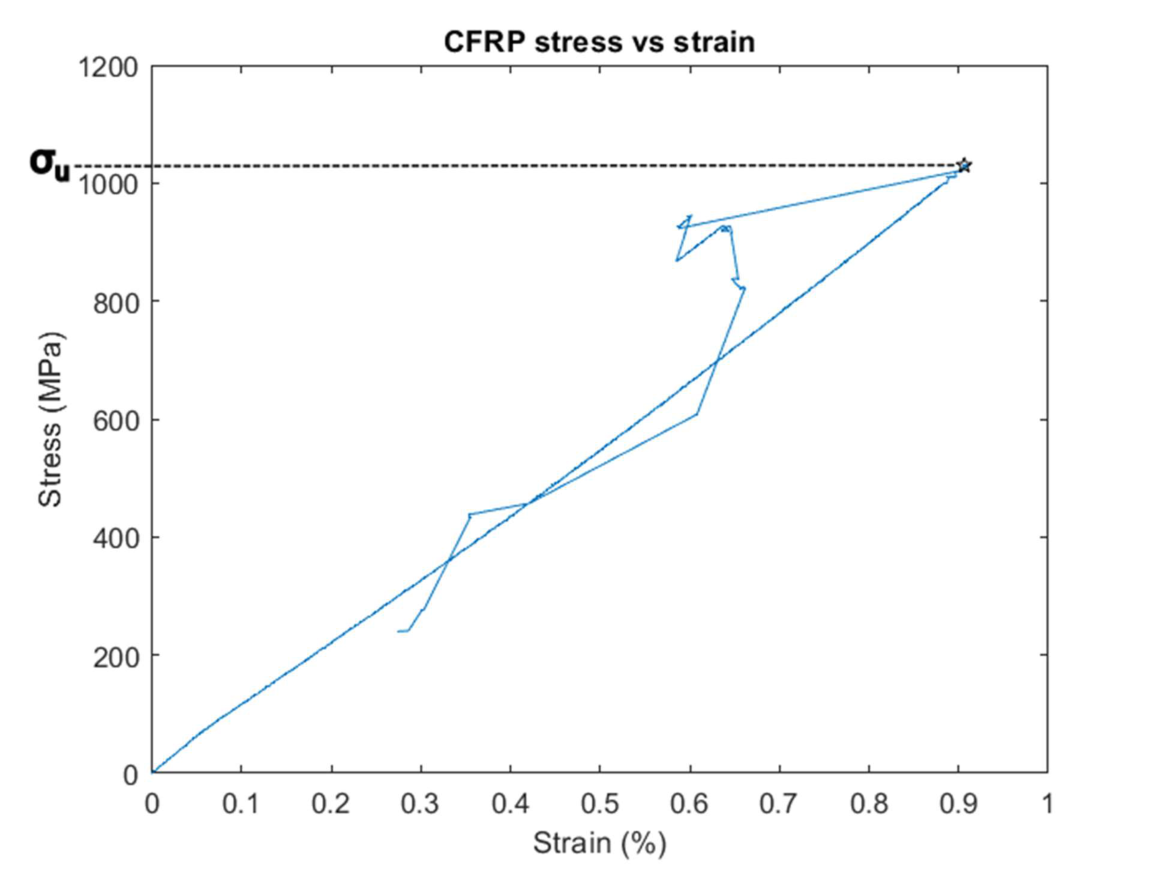
- CFRP stress-strain E = 1,118.6 MPa — showed ~49% error vs. handbook. Rule-of-mixtures E = 126,984 MPa (Vf ≈ 55%) agreed within 6%, confirming that the stress-strain method cannot accurately capture CFRP modulus and that metallography-based analysis is required.
- Strength-to-weight ratios: Al-2024 = 178,777; GFRP = 250,482; CFRP = 717,297 MPa·mm³/g — CFRP outperforms aluminum by ~4× on this metric, directly explaining its dominance in modern aircraft primary structure.
MATLAB Code
Stress and strain were read from Tinius Olsen CSV output. Young’s modulus was averaged from five elastic-region data points, and rule-of-mixtures E was computed from fiber volume fraction measured in microscopy images.
% Young's modulus: average of 5 elastic-region points
E_Al = mean([Al_stress(10)/Al_strain(10), Al_stress(25)/Al_strain(25), ...
             Al_stress(50)/Al_strain(50), Al_stress(86)/Al_strain(86), ...
             Al_stress(90)/Al_strain(90)]);          % ≈ 693 MPa

% Rule of mixtures for CFRP
E_m = 3300;  E_f = 228000;            % MPa
Vf  = mean([Vf1, Vf2, Vf3, Vf4, Vf5]);  % fiber volume fraction from microscopy
E_c = E_m*(1-Vf) + E_f*Vf;           % ≈ 126,984 MPa

% Strength-to-weight: sigma_u / density
specific_strength = max(Al_stress) / (2.78e-3);  % MPa·mm³/g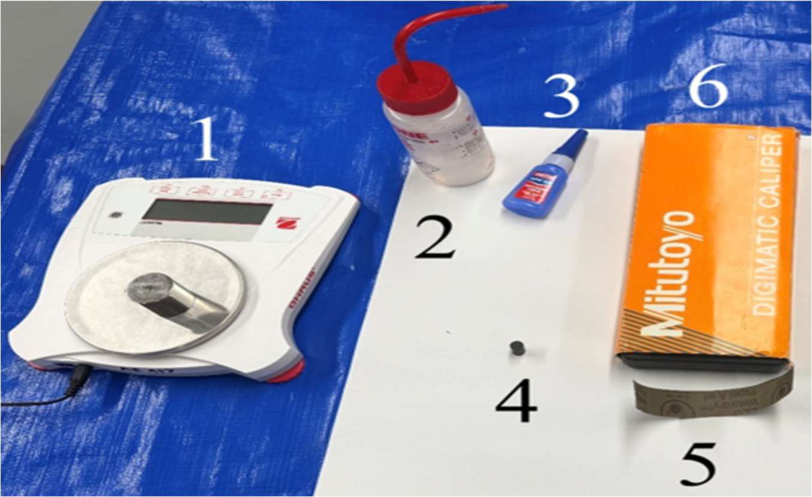
Valuable Takeaways
- No single test method works for all materials. The stress-strain approach accurately characterized aluminum and GFRP but failed for CFRP, where the rule of mixtures plus microstructural analysis was required — a lesson in choosing the right tool for the material at hand.
- CFRP’s specific strength advantage is enormous. At 717,297 MPa·mm³/g versus 178,777 for aluminum, CFRP can carry the same structural load at roughly a quarter of the weight — the driving force behind the Boeing 787 and Airbus A350 being >50% composite by weight.
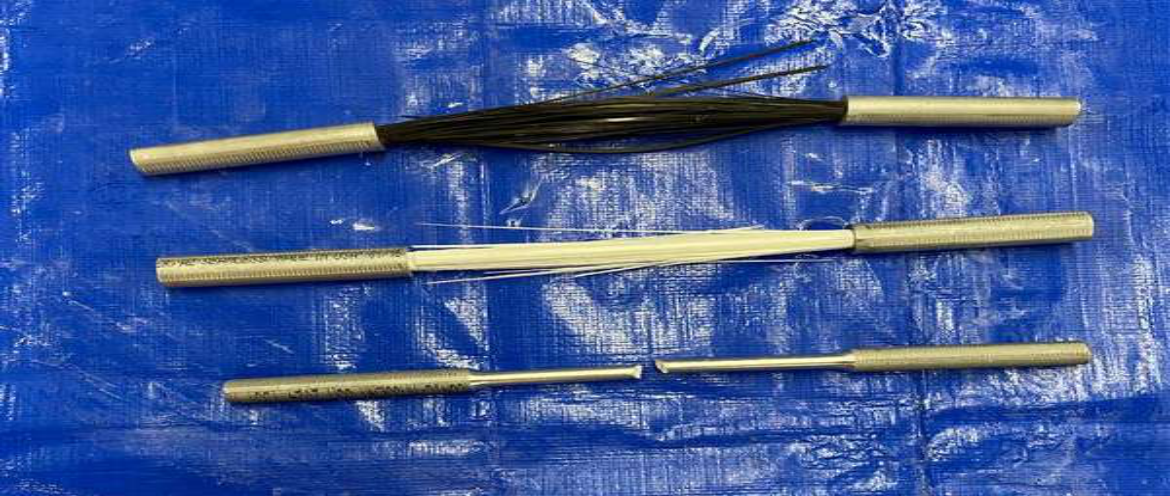
- Brittle vs. ductile failure modes tell different stories. Al-2024 yielded, necked, and fractured gradually; GFRP and CFRP fractured suddenly with no warning. This distinction drives damage tolerance requirements and inspection intervals for aerospace structures.
- Gained experience with the complete tensile test workflow: specimen preparation, extensometer attachment, universal testing machine operation, fracture characterization, and cross-validation using metallography.